AskCSV

About AskCSV
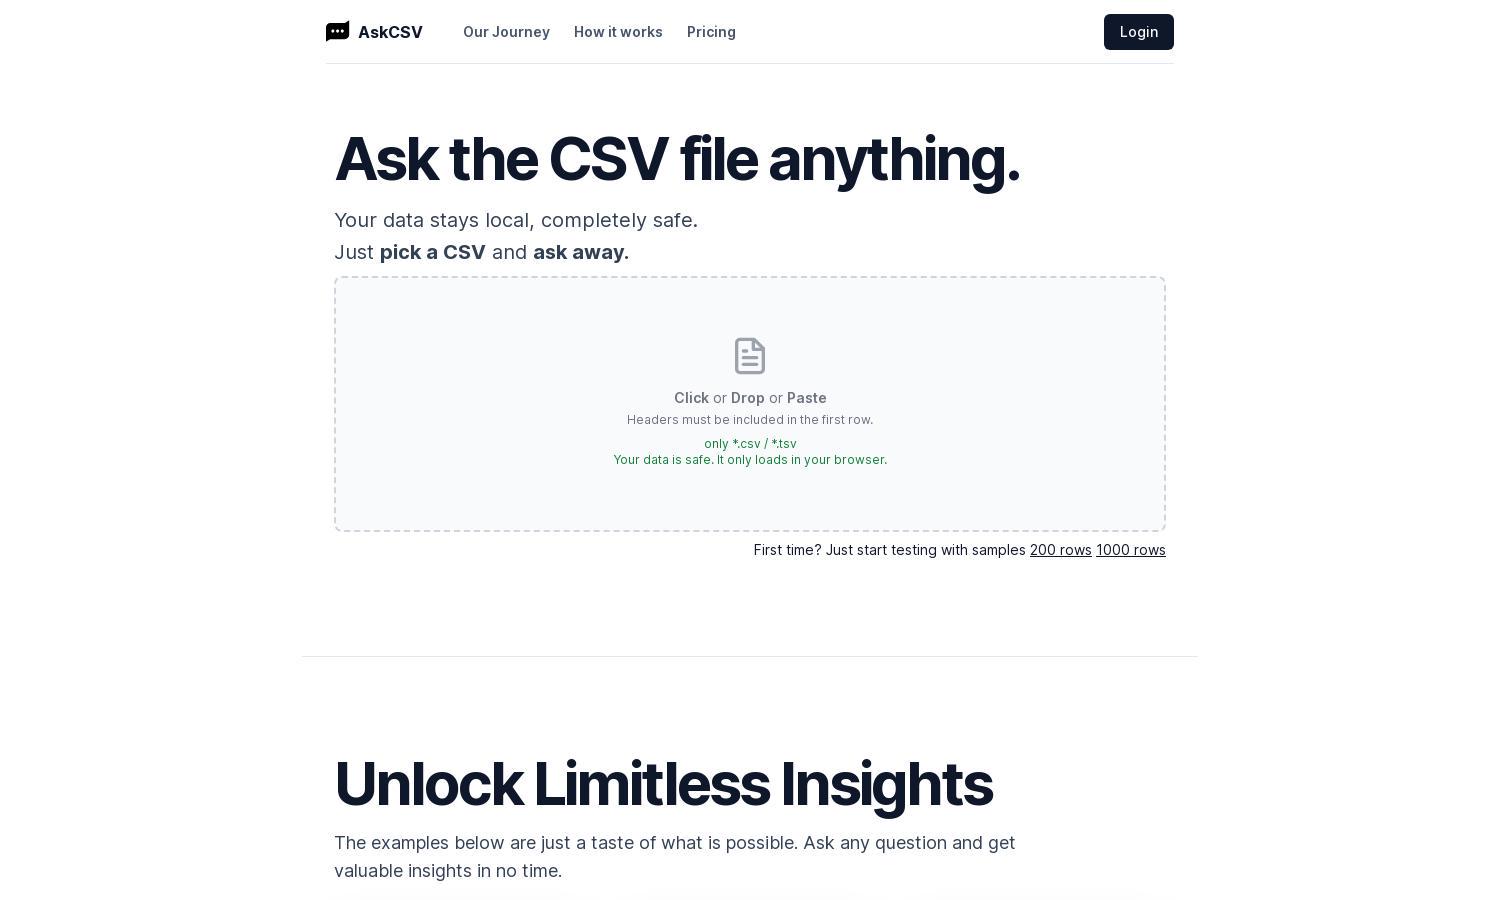
AskCSV is an intuitive platform designed to simplify data analysis for individuals and businesses. Users upload CSV files locally, ensuring data privacy, and interact with AI to gain insights and visualizations effortlessly. By enabling anyone to analyze data easily, AskCSV streamlines decision-making processes.
AskCSV offers a free tier for testing basic features, while premium plans provide expanded access to advanced analytics and visualizations. Users who upgrade benefit from enhanced features, priority support, and unlimited data analysis capabilities, making AskCSV a robust choice for serious data analysts.
The user interface of AskCSV is designed for simplicity and efficiency, offering a clean layout that enhances user experience. Easy navigation to features and intuitive data querying allow users to effortlessly derive insights from complex CSV files, making data analysis accessible for everyone.
How AskCSV works
To use AskCSV, users simply drop or paste their CSV files into the browser. The platform processes the data directly in-memory, ensuring security and privacy. Users can then ask questions and receive AI-generated insights or visualizations based on their queries, making data analysis straightforward and efficient.
Key Features for AskCSV
AI-Powered Insights
AskCSV features AI-powered insights that allow users to ask specific questions about their CSV data and receive instant visualizations and answers. This innovative functionality empowers users to derive meaningful insights quickly, enhancing their data analysis capabilities directly within their browsers.
Privacy-Focused Data Processing
AskCSV prioritizes user privacy by processing all data in-browser, ensuring that sensitive information never leaves the user's device. This unique feature not only safeguards users' data but also builds trust, allowing individuals and businesses to analyze data without security concerns.
Custom Visualization Options
With custom visualization options, AskCSV enables users to create tailored charts and graphs to represent their data effectively. This feature enhances the ability to communicate insights clearly, supporting users in making informed decisions backed by compelling data representations.
You may also like:


