Dividend Data vs Kapitol.ai
Side-by-side comparison to help you choose the right tool.
Dividend Data
Access 30+ years of dividend data, financials, and stock metrics instantly in your spreadsheets with our easy-to-use add-in for Excel and Google.
Last updated: March 11, 2026
Kapitol.ai
Track Congress's stock trades to follow the smart money and beat the market with free, actionable insights.
Last updated: March 26, 2026
Visual Comparison
Dividend Data

Kapitol.ai
Feature Comparison
Dividend Data
Free Tier with Monthly Credits
Dividend Data offers a generous free tier that provides users with 2,500 monthly credits, allowing them to explore the platform without any trial expiration. This feature is perfect for both novice investors who are just beginning their journey and experienced investors who want to test out the tool without financial commitment.
Custom Functions for Dividend Investors
The platform includes 16 custom functions tailored to meet the specific needs of dividend investors. From calculating forward-looking dividend yields to accessing earnings per share, these functions simplify complex financial analyses, enabling users to make informed investment decisions quickly.
Extensive Historical Data
With over 30 years of historical stock data, Dividend Data equips users with the ability to conduct thorough analyses of market trends and stock performance. This extensive data range allows investors to identify patterns, assess long-term growth opportunities, and understand the historical context of their investments.
Seamless Integration with Popular Spreadsheet Tools
Dividend Data works effortlessly within both Google Sheets and Microsoft Excel, making it accessible to a broad audience. This integration allows users to automate their data retrieval process, eliminating the need for tedious copy-pasting and enabling them to focus on analysis and strategy.
Kapitol.ai
Comprehensive Congressional Surveillance
Our system actively monitors all 535 members of the U.S. House and Senate, 24 hours a day, 7 days a week. The moment a new financial disclosure filing is published to any government database, our technology captures it. This ensures no trade, from any politician, slips through the cracks, giving you complete coverage of all legally required congressional stock activity as it happens.
Proprietary Insider Signal Scoring
Not every congressional trade is meaningful. We analyze each transaction through a multi-factor lens, scoring it as Low, Medium, High, or Critical. Our algorithm evaluates committee jurisdiction, trade size (position size), political timing, and sector relevance. This filtering isolates trades with the strongest insider signal, so you only spend time on moves that historically correlate with market-beating performance.
Plain-English Trade Analysis & Context
We deliver more than just raw data. Every high-signal trade in your feed is accompanied by a detailed analysis explaining exactly why it matters. We break down the politician's committee roles, the potential legislative or regulatory impacts on the traded company, and the historical context, turning complex political and financial information into clear, actionable investment theses.
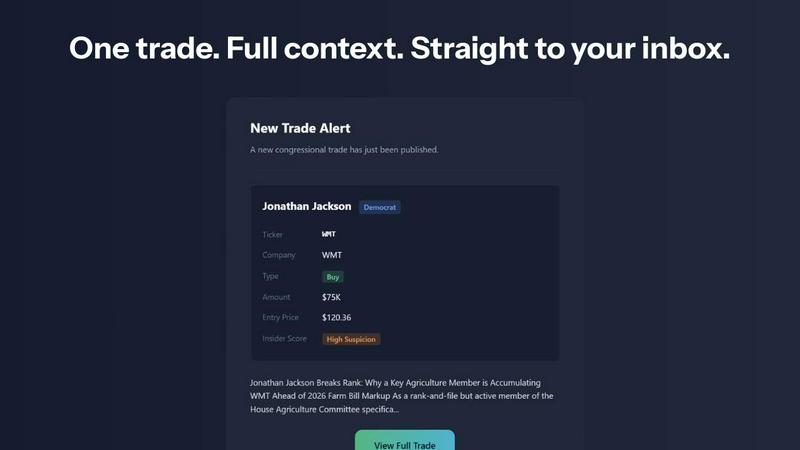
Real-Time Alerts & Live Trade Feed
Speed is critical. When a high-score trade is published, you receive an immediate email alert straight to your inbox. You can also monitor a live preview feed of the latest congressional trades directly on our platform. This system ensures you are among the first to know about critical market-moving activity, eliminating the need to manually scour government websites.
Use Cases
Dividend Data
Analyzing Dividend Stocks
Investors looking to analyze dividend stocks can utilize Dividend Data's custom functions to retrieve essential metrics like dividend yields and payout ratios. This helps them evaluate the sustainability of dividends and identify stocks that align with their investment goals.
Portfolio Management
Dividend Data enhances portfolio management by allowing users to track dividends automatically and link their portfolios directly to the tool. This feature enables investors to view aggregate statistics and make adjustments based on real-time performance data.
Conducting Fundamental Analysis
Fundamental investors can leverage Dividend Data to access a wealth of financial statements, earnings reports, and key ratios. This access allows for in-depth evaluations of a company's financial health and growth potential, aiding in more informed investment decisions.
Researching Historical Performance
With 30+ years of data available, investors can research and analyze historical stock performance. This valuable insight aids in understanding market cycles and identifying potential investment opportunities based on past trends.
Kapitol.ai
Retail Investors Seeking an Informational Edge
Individual investors tired of competing with institutional resources use Kapitol.ai to level the playing field. By following the highest-conviction trades from congressional insiders, they can identify potential winning stocks and sectors early, incorporating this unique data point into their broader research and investment decision-making process for a tangible edge.
Active Traders and Short-Term Strategists
Traders looking for catalyst-driven moves utilize our real-time alerts and scoring system to find short-to-medium-term opportunities. The "Critical" and "High" signal alerts, especially those tied to committee chairs and large position sizes, often precede market-moving news, providing a valuable signal for timing entries and exits in specific equities.
Political and Policy Analysts
Professionals who track the intersection of policy and markets use Kapitol.ai as a research tool. The aggregated trade data and analysis provide a clear, quantifiable window into what lawmakers themselves believe about the companies and industries they regulate, offering invaluable insights into potential future legislative or regulatory shifts.
Financial Content Creators and Journalists
Writers, journalists, and influencers covering finance or politics use the platform to discover compelling stories and data-driven angles. The curated feed and performance track record provide credible, sourced material for reporting on congressional stock activity, market trends, and the real-world impact of political insider knowledge.
Overview
About Dividend Data
Dividend Data is an innovative tool designed specifically for dividend and fundamental investors seeking seamless access to comprehensive stock market data. With over 30 years of historical information covering more than 80,000 tickers, Dividend Data integrates directly into Google Sheets and Microsoft Excel, allowing users to retrieve crucial financial metrics without the need for complicated API keys or coding knowledge. This user-friendly solution empowers investors by providing instant access to key data points such as dividends, yields, payout ratios, growth rates, financial statements, and earnings. By simply typing a custom formula into their spreadsheet, users can obtain real-time data, significantly enhancing their investment analysis and decision-making process. Whether you are a seasoned investor or just starting, Dividend Data serves as a powerful ally in navigating the complex world of stock investments, making it easier to track and understand dividend performance and overall financial health.
About Kapitol.ai
Kapitol.ai is a financial intelligence platform that solves a critical problem for investors: the information asymmetry created by legal congressional stock trading. While the STOCK Act mandates that all 535 members of Congress disclose their trades, these filings are buried in obscure government databases, presented in hard-to-read formats, and are nearly impossible to analyze in real-time. This creates a massive opportunity gap, as politicians consistently outperform the market by trading on non-public committee knowledge. Kapitol.ai bridges this gap. We provide a sophisticated surveillance system that monitors every congressional filing, instantly curates and scores each trade based on insider signal strength, and delivers only the highest-conviction moves directly to you with clear, plain-English analysis. Designed for retail investors, traders, and anyone seeking an edge, Kapitol.ai transforms opaque public data into actionable, timely intelligence, allowing you to follow the smart money in Washington before the broader market reacts.
Frequently Asked Questions
Dividend Data FAQ
What types of data can I access with Dividend Data?
You can access a wide range of data, including dividends, yields, payout ratios, growth rates, financial statements, earnings, ratios, price history, and over 100 other metrics.
Is there a limit to the number of credits I can use each month?
Yes, the free tier offers 2,500 monthly credits, which can be used to access various data points. This allows users to manage their usage without incurring unexpected costs.
Can I use Dividend Data on both Google Sheets and Excel?
Absolutely! Dividend Data is designed to work seamlessly with both Google Sheets and Microsoft Excel, making it convenient for users to choose their preferred platform.
Do I need any coding skills to use Dividend Data?
No coding skills are necessary. The platform is built for ease of use, allowing you to simply type a formula to retrieve live data directly into your spreadsheets.
Kapitol.ai FAQ
Is it legal for Congress members to trade stocks?
Yes, it is currently legal, though controversial. The STOCK Act of 2012 made it explicitly legal but mandated strict transparency, requiring politicians to publicly disclose their trades within 45 days. They are not allowed to trade on classified information, but they can legally act on non-public information gained from their committee work and legislative processes, which is the "insider knowledge" Kapitol.ai tracks.
How does Kapitol.ai's scoring system work?
Our proprietary algorithm scores each trade from Low to Critical based on the strength of the insider signal. Key factors include: the politician's committee assignments and direct jurisdiction over the traded company's industry, the size of the trade (position size), the timing relative to upcoming legislation or hearings, and the sector's political relevance. A "Critical" score is reserved for trades from committee chairs with maximum position size.
What is your track record of success?
Based on our analysis of 157+ curated trades from January 2025 to present, the aggregated performance shows a 68% win rate, with an average return of +19% after 3 months. Winning trades average a +32% gain, while losing trades average a -14% loss, creating a strong win/loss ratio of 2.3x. Performance generally improves with longer holding periods.
Is there really a free account?
Yes. We offer a free account that requires no credit card to sign up. This provides access to a live preview of congressional trades and basic platform features. For full access to all high-signal trades with complete analysis, real-time alerts, and our full historical track record, a paid subscription plan is available.
Alternatives
Dividend Data Alternatives
Dividend Data is a powerful tool designed for dividend and fundamental investors, offering over 30 years of stock market data for more than 80,000 tickers. It seamlessly integrates with Google Sheets and Microsoft Excel, providing instant access to essential metrics such as dividends, yields, and financial statements through simple formulas. Users often seek alternatives due to factors like pricing, specific feature sets, or compatibility with their preferred platforms. When searching for an alternative, it’s crucial to consider the breadth and depth of historical data offered, the ease of use in terms of integration with existing tools, and whether the pricing structure aligns with your budget. Additionally, evaluate the range of features that cater specifically to your investment strategies, ensuring the alternative meets your unique needs as an investor.
Kapitol.ai Alternatives
Kapitol.ai is a free tool in the business and finance category that tracks and analyzes the stock trades of U.S. Congress members. It filters through complex government filings to highlight only the highest-signal trades, providing plain-English analysis to help users potentially follow informed market moves. Users often explore alternatives for various reasons. Some may seek more advanced analytics, different alert methods, or a focus on other types of political intelligence beyond congressional trading. Others might require integration with specific brokerage platforms or desire a different pricing model beyond a free tier. When evaluating alternatives, consider the source and timeliness of the data, the quality and depth of the analysis provided, and the overall user experience. The core value lies in transforming opaque regulatory data into clear, actionable insights, so prioritize tools that excel at filtering noise and delivering high-conviction signals directly to you.