Dividend Data vs Prediction Pulse
Side-by-side comparison to help you choose the right tool.
Dividend Data
Access 30+ years of dividend data, financials, and stock metrics instantly in your spreadsheets with our easy-to-use add-in for Excel and Google.
Last updated: March 11, 2026
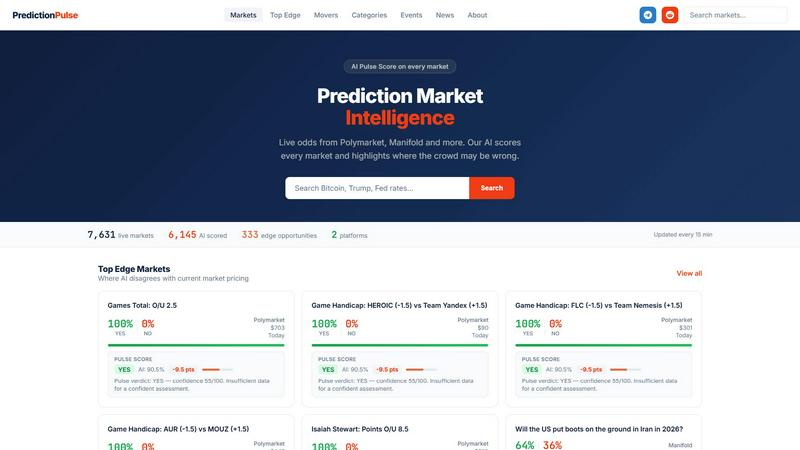
Prediction Pulse
Prediction Pulse leverages AI to analyze market probabilities, uncover trends, and identify opportunities for smarter decision-making.
Last updated: March 18, 2026
Visual Comparison
Dividend Data

Prediction Pulse
Feature Comparison
Dividend Data
Free Tier with Monthly Credits
Dividend Data offers a generous free tier that provides users with 2,500 monthly credits, allowing them to explore the platform without any trial expiration. This feature is perfect for both novice investors who are just beginning their journey and experienced investors who want to test out the tool without financial commitment.
Custom Functions for Dividend Investors
The platform includes 16 custom functions tailored to meet the specific needs of dividend investors. From calculating forward-looking dividend yields to accessing earnings per share, these functions simplify complex financial analyses, enabling users to make informed investment decisions quickly.
Extensive Historical Data
With over 30 years of historical stock data, Dividend Data equips users with the ability to conduct thorough analyses of market trends and stock performance. This extensive data range allows investors to identify patterns, assess long-term growth opportunities, and understand the historical context of their investments.
Seamless Integration with Popular Spreadsheet Tools
Dividend Data works effortlessly within both Google Sheets and Microsoft Excel, making it accessible to a broad audience. This integration allows users to automate their data retrieval process, eliminating the need for tedious copy-pasting and enabling them to focus on analysis and strategy.
Prediction Pulse
AI Pulse Score
The AI Pulse Score is a proprietary feature that assigns a probability score to each market, allowing users to quickly identify where the crowd might be misjudging outcomes. This score is updated every 15 minutes, providing timely insights and enhancing decision-making processes for traders and researchers.
Live Market Aggregation
Prediction Pulse aggregates live odds from multiple platforms, including Polymarket and Manifold. This feature enables users to compare probabilities across different marketplaces effortlessly, ensuring they are always aware of the latest developments and market sentiments.
Event Intelligence
The platform offers comprehensive event pages that provide in-depth analysis on various real-world events. Users can explore historical data, current market trends, and expert opinions, equipping them with the knowledge needed to make well-informed predictions.
AI-Generated News
In addition to market data, Prediction Pulse generates AI-driven news content that covers significant movements in prediction markets. This feature keeps users updated on critical developments and helps them understand the broader implications of market changes, thereby enriching their strategic approach to trading.
Use Cases
Dividend Data
Analyzing Dividend Stocks
Investors looking to analyze dividend stocks can utilize Dividend Data's custom functions to retrieve essential metrics like dividend yields and payout ratios. This helps them evaluate the sustainability of dividends and identify stocks that align with their investment goals.
Portfolio Management
Dividend Data enhances portfolio management by allowing users to track dividends automatically and link their portfolios directly to the tool. This feature enables investors to view aggregate statistics and make adjustments based on real-time performance data.
Conducting Fundamental Analysis
Fundamental investors can leverage Dividend Data to access a wealth of financial statements, earnings reports, and key ratios. This access allows for in-depth evaluations of a company's financial health and growth potential, aiding in more informed investment decisions.
Researching Historical Performance
With 30+ years of data available, investors can research and analyze historical stock performance. This valuable insight aids in understanding market cycles and identifying potential investment opportunities based on past trends.
Prediction Pulse
Market Analysis for Traders
Traders can use Prediction Pulse to analyze various prediction markets and identify profitable trading opportunities. The AI-driven insights and the Pulse Score provide a competitive edge, allowing users to make data-informed decisions based on the most reliable probabilities.
Research and Academia
Researchers studying behavioral economics or decision-making can leverage Prediction Pulse to examine how markets react to specific events. The platform's rich data set and analytical tools enable in-depth studies and foster a deeper understanding of market dynamics.
Event Forecasting
Organizations and individuals interested in forecasting future events can utilize Prediction Pulse to gauge public sentiment and market expectations. By analyzing aggregated data and AI insights, users can refine their predictions and strategies based on real-time market signals.
Risk Management
Companies looking to manage risks associated with uncertain events can benefit from the predictive capabilities of Prediction Pulse. The platform helps organizations identify potential mispricings and adjust their strategies accordingly, minimizing exposure to unforeseen developments.
Overview
About Dividend Data
Dividend Data is an innovative tool designed specifically for dividend and fundamental investors seeking seamless access to comprehensive stock market data. With over 30 years of historical information covering more than 80,000 tickers, Dividend Data integrates directly into Google Sheets and Microsoft Excel, allowing users to retrieve crucial financial metrics without the need for complicated API keys or coding knowledge. This user-friendly solution empowers investors by providing instant access to key data points such as dividends, yields, payout ratios, growth rates, financial statements, and earnings. By simply typing a custom formula into their spreadsheet, users can obtain real-time data, significantly enhancing their investment analysis and decision-making process. Whether you are a seasoned investor or just starting, Dividend Data serves as a powerful ally in navigating the complex world of stock investments, making it easier to track and understand dividend performance and overall financial health.
About Prediction Pulse
Prediction Pulse is a cutting-edge AI-powered intelligence platform designed for navigating the complex world of prediction markets. By aggregating data from leading platforms such as Polymarket and Manifold, it organizes these markets into canonical real-world events and employs a proprietary Pulse Score probability engine to analyze them. This unique approach allows Prediction Pulse to track thousands of live markets, utilizing advanced AI algorithms to estimate the most probable outcomes, identify potential mispricing, and elucidate the reasoning behind specific event resolutions. The platform is tailored for traders, researchers, and anyone curious about market signals regarding future events. Its rich feature set includes live odds comparisons, AI-generated insights, and extensive event pages, all aimed at enhancing users' understanding of what prediction markets are indicating. Ultimately, Prediction Pulse empowers users to make informed decisions by combining market aggregation, event intelligence, and AI-driven probability assessments.
Frequently Asked Questions
Dividend Data FAQ
What types of data can I access with Dividend Data?
You can access a wide range of data, including dividends, yields, payout ratios, growth rates, financial statements, earnings, ratios, price history, and over 100 other metrics.
Is there a limit to the number of credits I can use each month?
Yes, the free tier offers 2,500 monthly credits, which can be used to access various data points. This allows users to manage their usage without incurring unexpected costs.
Can I use Dividend Data on both Google Sheets and Excel?
Absolutely! Dividend Data is designed to work seamlessly with both Google Sheets and Microsoft Excel, making it convenient for users to choose their preferred platform.
Do I need any coding skills to use Dividend Data?
No coding skills are necessary. The platform is built for ease of use, allowing you to simply type a formula to retrieve live data directly into your spreadsheets.
Prediction Pulse FAQ
How does Prediction Pulse calculate the AI Pulse Score?
The AI Pulse Score is determined using advanced algorithms that analyze historical data, current market trends, and various contributing factors to predict outcomes. This scoring system helps users identify discrepancies between market sentiment and AI analysis.
Can I access data from multiple prediction markets on Prediction Pulse?
Yes, Prediction Pulse aggregates data from several prediction markets, including Polymarket and Manifold. This allows users to compare live odds and probabilities across different platforms seamlessly.
Is Prediction Pulse suitable for beginners in prediction markets?
Absolutely. Prediction Pulse is designed for users of all experience levels. Its user-friendly interface, comprehensive event pages, and AI-generated insights provide valuable resources for beginners to understand prediction markets effectively.
How often is the data on Prediction Pulse updated?
Data on Prediction Pulse is updated every 15 minutes, ensuring users have access to the latest information and market conditions. This frequent updating allows for timely decision-making based on current trends.
Alternatives
Dividend Data Alternatives
Dividend Data is a powerful tool designed for dividend and fundamental investors, offering over 30 years of stock market data for more than 80,000 tickers. It seamlessly integrates with Google Sheets and Microsoft Excel, providing instant access to essential metrics such as dividends, yields, and financial statements through simple formulas. Users often seek alternatives due to factors like pricing, specific feature sets, or compatibility with their preferred platforms. When searching for an alternative, it’s crucial to consider the breadth and depth of historical data offered, the ease of use in terms of integration with existing tools, and whether the pricing structure aligns with your budget. Additionally, evaluate the range of features that cater specifically to your investment strategies, ensuring the alternative meets your unique needs as an investor.
Prediction Pulse Alternatives
Prediction Pulse is an advanced AI-powered intelligence platform that specializes in prediction markets. It aggregates data from various platforms, analyzes market probabilities, trends, and outcomes related to real-world events, enabling users to make informed decisions based on these insights. Users often seek alternatives to Prediction Pulse for various reasons, including pricing considerations, feature requirements, and specific platform needs that may not be fully addressed by this service. When searching for an alternative, it’s crucial to assess the features offered, such as market aggregation capabilities, the depth of analysis, user interface, and overall value for money. Additionally, consider the level of AI integration, the ability to track multiple markets, and how well the platform communicates insights and trends. Finding an option that aligns with your specific goals and user experience preferences can greatly enhance your decision-making in prediction markets.