Fusedash vs StatPecker
Side-by-side comparison to help you choose the right tool.
Fusedash transforms raw data into intuitive dashboards and charts, empowering teams to act on insights instantly.
Last updated: March 4, 2026

StatPecker
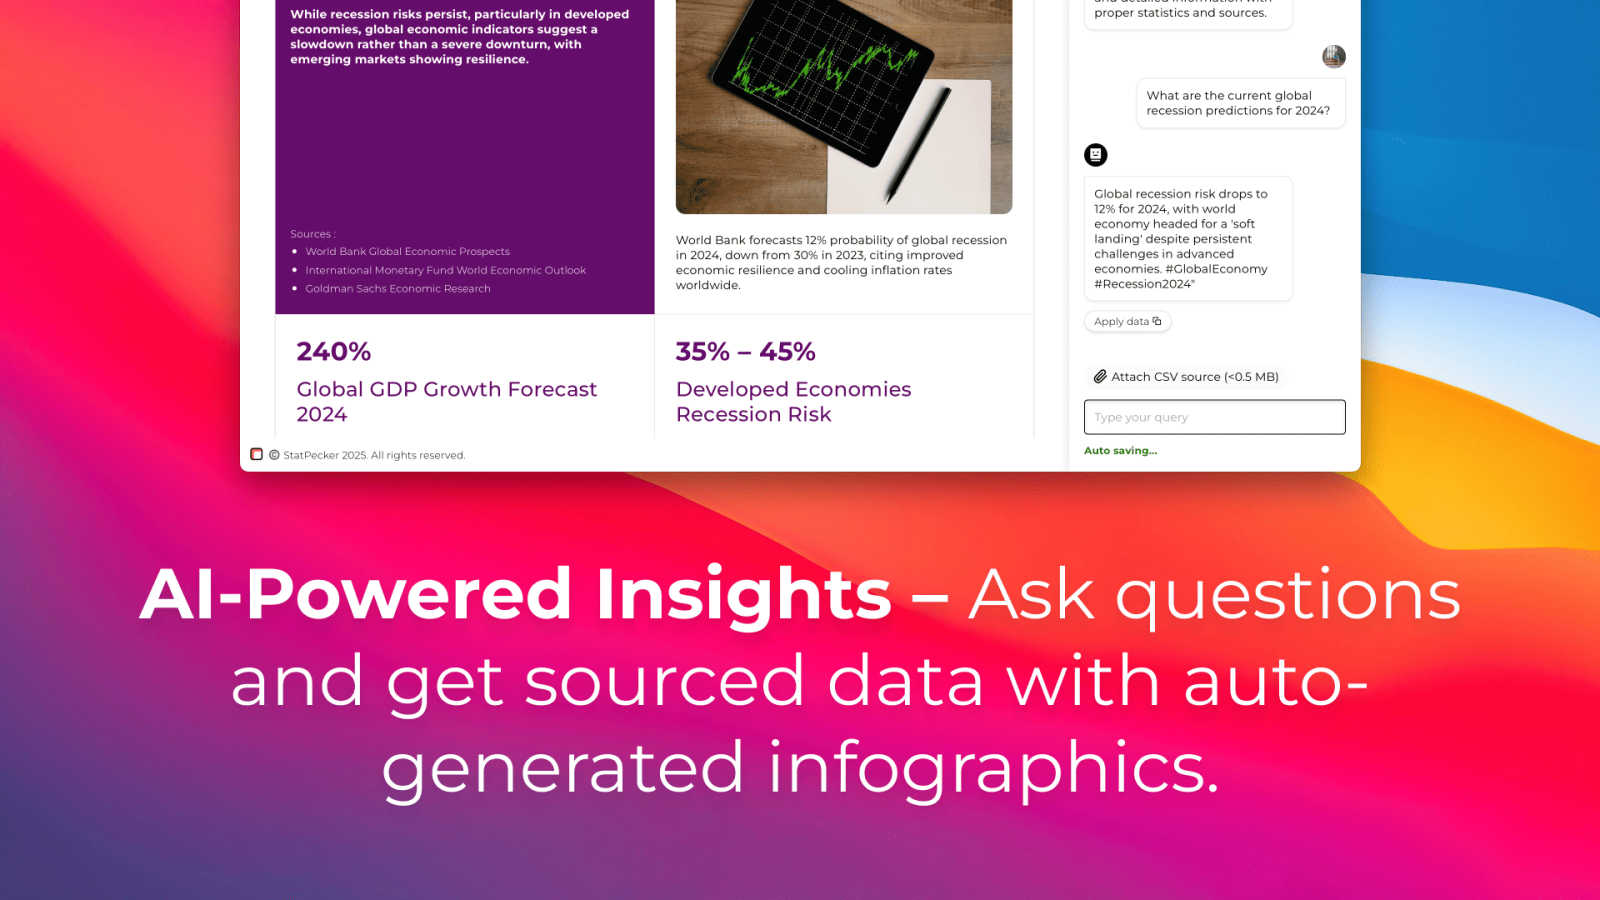
StatPecker turns your data into instant AI insights and stunning visuals for smarter decisions.
Last updated: March 1, 2026
Visual Comparison
Fusedash

StatPecker
Feature Comparison
Fusedash
Flexible Views
Fusedash allows users to create customized dashboard views tailored to different audiences within the organization. This feature enables teams to transform the same dataset into various formats, including dashboards, charts, maps, or report-style views, ensuring that stakeholders have access to the insights that matter most without unnecessary back-and-forth.
AI Chart Generator
The AI Chart Generator empowers users to create visually appealing charts from their data in minutes. By simply uploading a CSV or connecting an API, users can generate clear visuals, apply comparisons, and refine labels, ensuring that each chart effectively tells the intended story. These charts can be incorporated into dashboards or used as standalone visuals for reporting.
Comprehensive Dashboard Software
Fusedash acts as a centralized workspace for dashboards and reporting, combining performance metrics with narrative context. This helps teams understand not only what has changed but also why it matters and what steps to take next. By integrating storytelling into dashboards, Fusedash keeps teams aligned and minimizes discrepancies in reporting.
Smart AI Chat
The Smart AI Chat feature allows users to interact with their data using natural language. This tool helps users ask questions, explore breakdowns, and receive suggestions for the most relevant charts or metrics. The insights gathered from these interactions can be quickly transformed into shareable dashboard views for immediate use.
StatPecker
Ask Your Query & Get AI Insights
Simply ask a question in plain English, and StatPecker's AI will scour validated sources to generate instant insights. There's no need to learn complex query languages or data manipulation tools. This feature democratizes data analysis, allowing anyone from a marketer to a manager to get credible answers and visual summaries on demand, streamlining the research and reporting process dramatically.
Local SQL Agent for Private CSV Analysis
This powerful feature addresses critical concerns around data privacy and convenience. You can upload a CSV file (up to 50 MB) directly to your device. StatPecker's local engine then prepares and analyzes the data entirely on your machine. You can ask specific questions about your private dataset, and it generates SQL queries and visual answers without your sensitive information ever leaving your computer, ensuring complete security and control.
Publish & Embed Interactive Visuals
Once you create a chart or infographic, StatPecker allows you to seamlessly publish and embed it into any blog, article, website, or internal wiki. The visuals are interactive and maintain a professional appearance, enhancing your content's credibility and engagement without requiring any coding or web development skills. This turns static data into a dynamic part of your digital storytelling.
Download & Use Anywhere
For offline reports, presentations, or social media, you can export your infographics as high-quality image files. This flexibility ensures the visuals you create can be utilized across any medium—be it a PowerPoint slide, a printed report, a newsletter, or a social media post. It guarantees that your data storytelling is consistent and impactful across all communication channels.
Use Cases
Fusedash
Marketing Performance Analysis
Marketing teams can leverage Fusedash to build dashboards that track campaign performance in real time. By monitoring key metrics, such as conversion rates and engagement levels, marketers can quickly identify successful strategies and areas needing improvement, leading to more effective campaigns.
Operations Monitoring
Operations teams can utilize Fusedash to create visual reports that track supply chain performance and operational efficiency. By visualizing data trends, they can pinpoint inefficiencies, ensuring timely interventions to optimize processes and reduce costs.
Sales Pipeline Tracking
Sales teams can rely on Fusedash to visualize their sales pipeline, tracking metrics such as lead conversion rates and sales forecasts. This visibility helps sales managers make informed decisions and allocate resources effectively, ultimately driving revenue growth.
Financial Reporting
Finance teams can use Fusedash to create comprehensive financial reports that combine historical data with real-time insights. By visualizing key performance indicators, such as revenue and expenses, teams can gain a clearer understanding of financial health and make strategic decisions accordingly.
StatPecker
Content Creators & Bloggers
Content creators and bloggers can use StatPecker to quickly research and visualize data that supports their articles. Instead of describing trends with text, they can embed interactive charts that cite credible sources, making their content more authoritative, shareable, and engaging for their audience, which helps boost SEO and reader trust.
Marketing Teams & Analysts
Marketing teams need to report on campaign performance, market research, and competitor analysis. StatPecker allows them to upload campaign data CSVs, ask specific questions about ROI or audience demographics, and instantly generate visuals for stakeholder presentations or dashboards, speeding up the insight-to-action cycle.
Educators & Trainers
Educators can transform dry statistical information or historical data into captivating infographics for lectures, course materials, or student assignments. This visual approach aids in comprehension, makes learning more interactive, and helps students grasp complex concepts through clear, graphical representations.
Startup Founders & Consultants
Startup founders and consultants often need to present data to investors, clients, or internal teams with limited resources. StatPecker enables them to create professional-looking charts from their operational or financial data quickly, helping them tell a compelling story of growth, opportunity, or strategy without a design budget.
Overview
About Fusedash
Fusedash is an innovative AI-powered data visualization platform that revolutionizes how teams interact with their data. Designed for organizations that seek actionable insights from connected data, Fusedash enables users to create dynamic dashboards, interactive charts, detailed maps, and narrative reports within a single, cohesive workspace. The platform eliminates the need to replicate logic across multiple tools, allowing users to define key metrics and KPIs once and reuse them across various views and reports. This consistency fosters trust in data across all levels of the organization, from leadership to operations. Fusedash is tailored for teams weary of manual reporting cycles and conflicting data narratives, empowering them to monitor real-time developments while understanding the underlying reasons for changes. With integrated AI features, such as natural language data chat and smart visualization assistance, Fusedash accelerates data exploration and reporting, transforming raw data into a reliable source of truth that drives alignment and informed decision-making.
About StatPecker
In today's data-driven world, professionals face a common and frustrating challenge: they are surrounded by valuable information but struggle to communicate it effectively. Raw spreadsheets and complex datasets are difficult to interpret and fail to engage audiences, leaving key insights buried. Traditional solutions like manual design or hiring expensive data visualization specialists are time-consuming, costly, and inaccessible for many teams. This gap between having data and telling its story hinders decision-making and dilutes the impact of reports, presentations, and content.
StatPecker is the definitive solution to this problem. It is an innovative AI-powered platform that transforms raw data into compelling, visually engaging infographics and charts within seconds. Designed for content creators, marketers, business analysts, and educators, StatPecker automates the entire process of data storytelling. It eliminates the need for manual design skills or complex software, making professional-grade data visualization accessible to everyone. The core value proposition is powerful yet simple: turn your questions and data files into credible, publishable insights instantly. With features like on-device CSV analysis and seamless embedding, StatPecker not only saves significant time and resources but also ensures that data-driven insights are clear, impactful, and ready to share with the world.
Frequently Asked Questions
Fusedash FAQ
What types of data can I connect with Fusedash?
Fusedash supports various data sources, including CSV uploads, API connections, and public datasets. This flexibility allows users to integrate diverse data streams into a single platform for comprehensive analysis.
Can I customize my dashboards in Fusedash?
Yes, Fusedash offers extensive customization options for dashboards. Users can modify layouts, apply filters, and define time ranges, ensuring that each dashboard meets the specific needs of its intended audience.
Is there a limit to the number of dashboards I can create?
Fusedash does not impose limits on the number of dashboards you can create. Users can design as many dashboards as needed to monitor different aspects of their business, making it a versatile tool for any organization.
How does Fusedash ensure data consistency across reports?
Fusedash allows users to define key metrics and KPIs once, which can then be reused across all dashboards and reports. This standardization helps maintain consistency in data interpretation, reducing discrepancies and enhancing trust among stakeholders.
StatPecker FAQ
How does the Local SQL Agent ensure my data is private?
The Local SQL Agent is designed with privacy as the default. When you upload a CSV file, the entire processing and analysis pipeline runs locally on your own device. Your raw data never leaves your computer to be sent to external servers. The AI generates queries and creates visuals using an on-device engine, ensuring your sensitive business or personal data remains completely secure and under your control.
What formats can I export my infographics in?
You can download and export the infographics and charts you create in StatPecker as high-quality image files, such as PNG. This makes them perfectly suitable for inclusion in reports, slide decks (PowerPoint, Google Slides), printed materials, websites, and social media posts, providing maximum flexibility for your data storytelling needs.
Is there a limit on queries or uploads in the free tier?
Yes, the Free Tier is designed to let you explore StatPecker's core capabilities. It includes 25 AI queries to ask questions from public data and allows for 10 CSV uploads to analyze with the Local SQL Agent. This is ideal for individuals or teams just starting with data visualization who want to test the platform's value before committing.
What does "Lifetime Access" in the paid plan include?
The one-time payment "Lifetime Access" plan grants you permanent access to all current and future features of StatPecker. This includes unlimited AI queries, unlimited CSV uploads for private analysis, unlimited projects and embeds, and priority consideration for new feature requests. It's a cost-effective solution for professionals who anticipate regular, long-term use.
Alternatives
Fusedash Alternatives
Fusedash is an AI-powered data visualization platform that helps teams convert their raw data into meaningful dashboards and charts, enabling immediate action on insights. As part of the analytics and business intelligence category, it centralizes data management, allowing users to create consistent and efficient reporting without the hassle of juggling multiple tools. Users often seek alternatives for various reasons, including pricing concerns, specific feature requirements, or the need for compatibility with different platforms. When choosing an alternative, it is essential to consider factors such as ease of use, the ability to integrate with existing systems, data security, and the flexibility to tailor dashboards to meet unique business needs.
StatPecker Alternatives
StatPecker is an AI-powered data visualization tool that automates the process of transforming raw data into compelling infographics and insights. It belongs to the category of automated data storytelling platforms, designed to save time for professionals who need to communicate data clearly. Users often explore alternatives to StatPecker for various reasons. Common considerations include budget constraints and specific pricing models, the need for different or more advanced analytical features, or requirements for integration with other business platforms and software in their stack. When evaluating other tools in this category, it's wise to assess a few key areas. Look for the core ability to turn data into clear narratives effortlessly, the flexibility in sharing and embedding outputs, and the overall value relative to the investment. The right alternative should align with your primary use case, whether it's for internal reporting, public content, or in-depth analysis.