StatPecker
StatPecker turns your data into instant AI insights and stunning visuals for smarter decisions.
Visit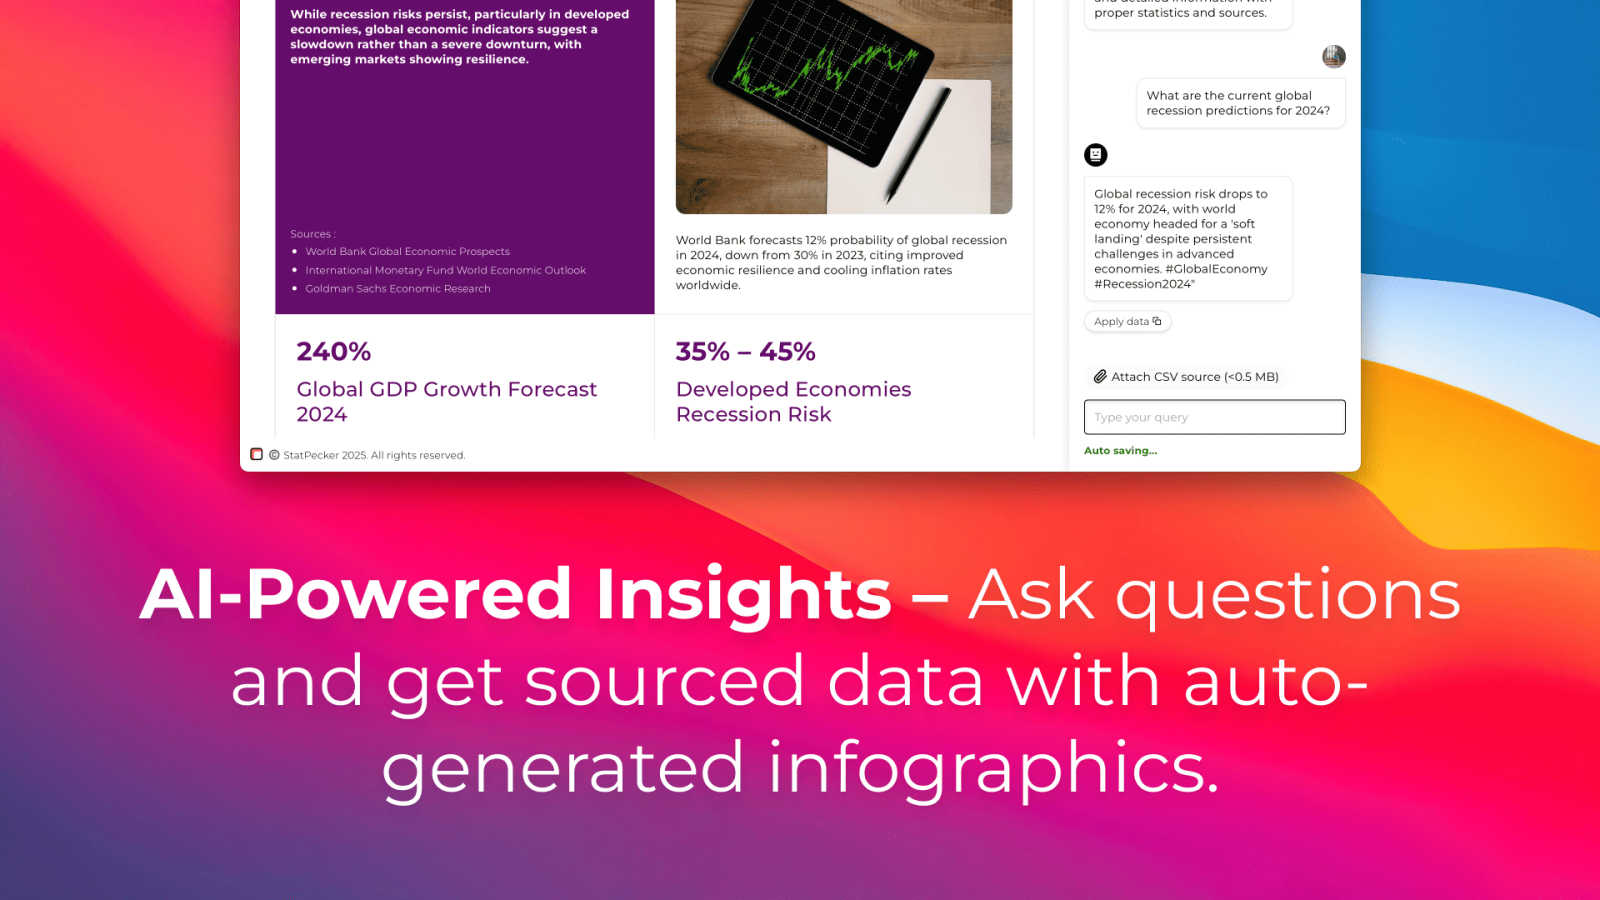
About StatPecker
In today's data-driven world, professionals face a common and frustrating challenge: they are surrounded by valuable information but struggle to communicate it effectively. Raw spreadsheets and complex datasets are difficult to interpret and fail to engage audiences, leaving key insights buried. Traditional solutions like manual design or hiring expensive data visualization specialists are time-consuming, costly, and inaccessible for many teams. This gap between having data and telling its story hinders decision-making and dilutes the impact of reports, presentations, and content.
StatPecker is the definitive solution to this problem. It is an innovative AI-powered platform that transforms raw data into compelling, visually engaging infographics and charts within seconds. Designed for content creators, marketers, business analysts, and educators, StatPecker automates the entire process of data storytelling. It eliminates the need for manual design skills or complex software, making professional-grade data visualization accessible to everyone. The core value proposition is powerful yet simple: turn your questions and data files into credible, publishable insights instantly. With features like on-device CSV analysis and seamless embedding, StatPecker not only saves significant time and resources but also ensures that data-driven insights are clear, impactful, and ready to share with the world.
Features of StatPecker
Ask Your Query & Get AI Insights
Simply ask a question in plain English, and StatPecker's AI will scour validated sources to generate instant insights. There's no need to learn complex query languages or data manipulation tools. This feature democratizes data analysis, allowing anyone from a marketer to a manager to get credible answers and visual summaries on demand, streamlining the research and reporting process dramatically.
Local SQL Agent for Private CSV Analysis
This powerful feature addresses critical concerns around data privacy and convenience. You can upload a CSV file (up to 50 MB) directly to your device. StatPecker's local engine then prepares and analyzes the data entirely on your machine. You can ask specific questions about your private dataset, and it generates SQL queries and visual answers without your sensitive information ever leaving your computer, ensuring complete security and control.
Publish & Embed Interactive Visuals
Once you create a chart or infographic, StatPecker allows you to seamlessly publish and embed it into any blog, article, website, or internal wiki. The visuals are interactive and maintain a professional appearance, enhancing your content's credibility and engagement without requiring any coding or web development skills. This turns static data into a dynamic part of your digital storytelling.
Download & Use Anywhere
For offline reports, presentations, or social media, you can export your infographics as high-quality image files. This flexibility ensures the visuals you create can be utilized across any medium—be it a PowerPoint slide, a printed report, a newsletter, or a social media post. It guarantees that your data storytelling is consistent and impactful across all communication channels.
Use Cases of StatPecker
Content Creators & Bloggers
Content creators and bloggers can use StatPecker to quickly research and visualize data that supports their articles. Instead of describing trends with text, they can embed interactive charts that cite credible sources, making their content more authoritative, shareable, and engaging for their audience, which helps boost SEO and reader trust.
Marketing Teams & Analysts
Marketing teams need to report on campaign performance, market research, and competitor analysis. StatPecker allows them to upload campaign data CSVs, ask specific questions about ROI or audience demographics, and instantly generate visuals for stakeholder presentations or dashboards, speeding up the insight-to-action cycle.
Educators & Trainers
Educators can transform dry statistical information or historical data into captivating infographics for lectures, course materials, or student assignments. This visual approach aids in comprehension, makes learning more interactive, and helps students grasp complex concepts through clear, graphical representations.
Startup Founders & Consultants
Startup founders and consultants often need to present data to investors, clients, or internal teams with limited resources. StatPecker enables them to create professional-looking charts from their operational or financial data quickly, helping them tell a compelling story of growth, opportunity, or strategy without a design budget.
Frequently Asked Questions
How does the Local SQL Agent ensure my data is private?
The Local SQL Agent is designed with privacy as the default. When you upload a CSV file, the entire processing and analysis pipeline runs locally on your own device. Your raw data never leaves your computer to be sent to external servers. The AI generates queries and creates visuals using an on-device engine, ensuring your sensitive business or personal data remains completely secure and under your control.
What formats can I export my infographics in?
You can download and export the infographics and charts you create in StatPecker as high-quality image files, such as PNG. This makes them perfectly suitable for inclusion in reports, slide decks (PowerPoint, Google Slides), printed materials, websites, and social media posts, providing maximum flexibility for your data storytelling needs.
Is there a limit on queries or uploads in the free tier?
Yes, the Free Tier is designed to let you explore StatPecker's core capabilities. It includes 25 AI queries to ask questions from public data and allows for 10 CSV uploads to analyze with the Local SQL Agent. This is ideal for individuals or teams just starting with data visualization who want to test the platform's value before committing.
What does "Lifetime Access" in the paid plan include?
The one-time payment "Lifetime Access" plan grants you permanent access to all current and future features of StatPecker. This includes unlimited AI queries, unlimited CSV uploads for private analysis, unlimited projects and embeds, and priority consideration for new feature requests. It's a cost-effective solution for professionals who anticipate regular, long-term use.
Pricing of StatPecker
StatPecker offers a straightforward pricing model with two main tiers:
Free Tier ($0): This plan is perfect for getting started and includes unlimited projects, unlimited embeds (with manual edits), 25 AI queries, and 10 CSV uploads for local analysis.
Lifetime Access ($150 one-time payment): This is a limited-time offer providing permanent access to all features. It includes unlimited AI queries, unlimited CSV uploads, unlimited projects and embeds, priority feature requests, and comes with a 10-day no-questions-asked refund policy.
Explore more in this category:
Similar to StatPecker
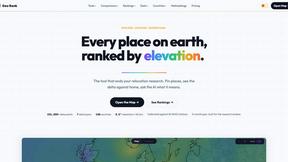
GeoRank
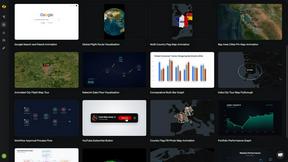
GeoRank.place is a map-based tool that visualizes and compares global data to help digital nomads and expats decide where to relocate next.

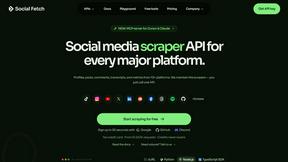
Social Fetch
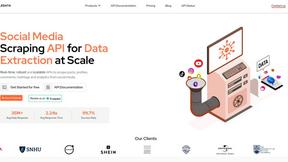
Social media scraper API: scrape profiles, posts, comments, and transcripts from TikTok, Instagram, YouTube, X, and 20+ platforms via REST.
Easymotion - AI Motion Graphic Generator
AI motion graphics and map animation generator for content creators, editors, founders and marketers.
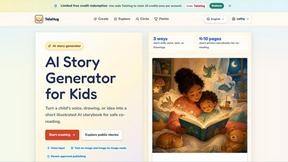
TaleHug AI Story Generator for Kids
Create customizable AI-powered picture-first stories for kids with ease.
EnsembleData
EnsembleData provides real-time APIs to effortlessly scrape and analyze social media data for informed business decisions.
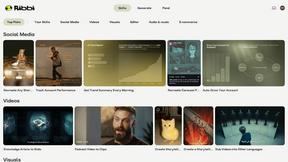
Ribbi
Stop drowning in content creation; Ribbi is your self-evolving AI agent that automates, recreates, and grows your social media presence.