AECharts vs conceptviz
Side-by-side comparison to help you choose the right tool.
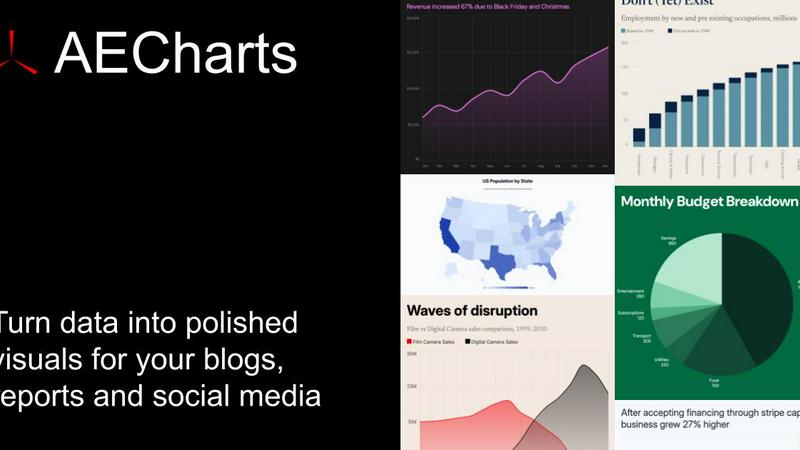
AECharts
Animated chart maker for presentations and videos
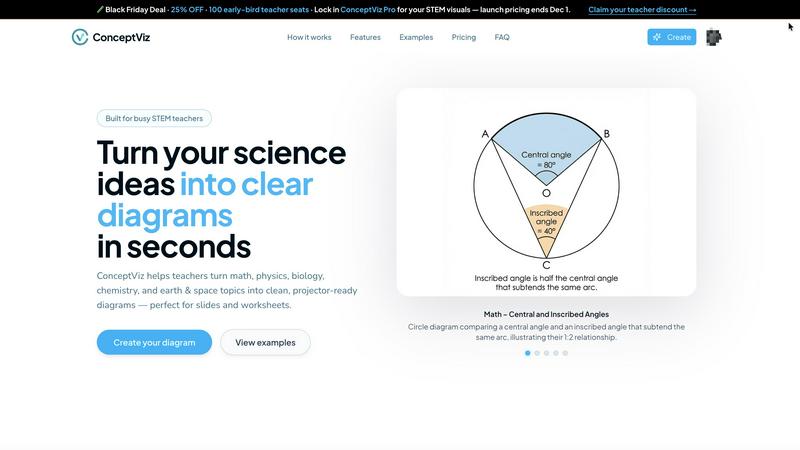
ConceptViz instantly creates clear, ready-to-use science and math diagrams for educators and researchers.
Last updated: February 28, 2026
Visual Comparison
AECharts
conceptviz
Overview
About AECharts
AECharts is a browser-based tool for creating animated chart videos — no design skills, no software installs, no video editing experience required. Upload a spreadsheet, paste your data, or connect a Google Sheet, and AECharts turns it into a polished animated video in minutes. Choose from bar charts, line charts, pie charts, bar chart races, and more. Every chart comes with professional templates you can customize: change colors, fonts, sizing, and branding to match your style.
When you're ready, export as MP4 and share anywhere — YouTube, LinkedIn, Instagram Reels, TikTok, presentations, newsletters, or pitch decks. Animated charts consistently outperform static images for engagement, and AECharts makes them as easy to produce as a screenshot.
Built for marketers, journalists, researchers, and founders who need to communicate data clearly and memo
About conceptviz
For educators, students, and researchers in STEM, creating clear, accurate, and classroom-ready diagrams is a persistent challenge. Scouring the internet for the "almost right" image, wrestling with complex design software, or spending hours hand-drawing visuals eats into precious preparation time and often yields inconsistent results. The struggle to translate complex scientific concepts into universally understandable visuals can hinder both teaching effectiveness and learning comprehension. ConceptViz directly solves this problem. It is an innovative AI-powered platform designed to generate precise, projector-ready diagrams in seconds. Users simply describe the visual they need in plain English, and ConceptViz automatically creates a high-quality, optimized illustration. Tailored specifically for STEM subjects—from K-12 physics and biology to graduate-level research—it ensures every diagram is built with educational clarity in mind: high-contrast lines, readable labels, and minimal visual noise. The core value proposition is immense time savings paired with pedagogical precision, empowering educators to enhance lesson plans, lab activities, and assessments with professional-grade visuals that match their exact teaching narrative without requiring any design skill.