AECharts
Transform static data into animated video charts for presentations in seconds, no design skills required.
Visit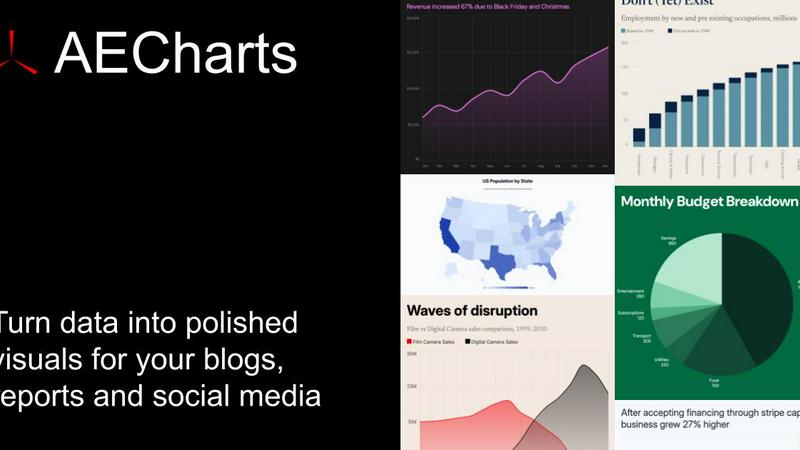
About AECharts
In today's fast-paced digital world, static charts and graphs are often overlooked. You have powerful data and a compelling story to tell, but your audience scrolls past or tunes out. The challenge is clear: how do you transform dry statistics into engaging, memorable content that drives action? Traditional video editing software is complex and time-consuming, while basic charting tools produce flat, uninspiring visuals. AECharts is the definitive solution. It is a browser-based animated chart maker designed to turn your spreadsheet data into professional, animated video charts in minutes, with no design skills, software installs, or video editing experience required. Built for marketers, journalists, researchers, and founders, AECharts solves the critical problem of data communication. You simply upload a spreadsheet, paste your data, or connect a Google Sheet. The platform then empowers you to choose from over 14 chart types—including bar chart races, line charts, and pie charts—and customize them with professional templates, your brand colors, fonts, and logos. The result is a polished animated MP4 video ready to outperform static images on YouTube, LinkedIn, Instagram Reels, TikTok, presentations, and reports. AECharts makes high-impact data storytelling as easy as taking a screenshot.
Features of AECharts
Browser-Based, No-Install Tool
AECharts operates entirely within your web browser, eliminating the need to download or install any complex software like Adobe After Effects. This removes a major barrier to entry, allowing anyone with an internet connection to start creating professional animated charts instantly. There's no waiting for downloads, managing updates, or worrying about system compatibility. You can access your projects and create compelling data videos from any computer, anywhere, making it incredibly flexible for teams and individuals on the go.
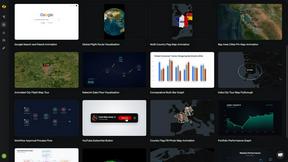
Extensive Chart Library & Templates
With support for 14+ chart types and growing, AECharts provides the versatility needed for any data story. Go beyond basic bar and line charts to dynamic bar chart races, insightful scatter plots, detailed treemaps, and attention-grabbing animated numbers. Each chart type comes with a selection of pre-built, professional templates that serve as a perfect starting point. These templates ensure your videos have a polished look from the outset, which you can then fine-tune to match your specific narrative and branding requirements.
Integrated Brand Kit & Customization
Maintaining consistent branding across all your content is a common challenge. AECharts solves this with an integrated Brand Kit feature. Once configured, your company's specific fonts, colors, and logo can be automatically applied to every chart you create. This ensures brand uniformity without manual effort on every project. Beyond branding, the platform offers deep customization for each element: adjust colors per data series, change fonts and label sizing, and control animation speed, all within an intuitive sidebar that provides a live preview of your changes.
Flexible Multi-Format Export
Your animated chart needs to work in multiple contexts, and AECharts delivers with flexible export options. You are not limited to a single output. When your chart is ready, export it as an MP4 video file for social media, presentations, or websites. Need a static image for a report or a slide? Export high-resolution PNG or JPEG files in various aspect ratios, including 16:9 for presentations, 1:1 for Instagram, and 4:5 for Reels and TikTok. This versatility ensures your data visualization is optimized for every platform and use case.
Use Cases of AECharts
Social Media & Digital Marketing Content
Marketers face the constant challenge of creating scroll-stopping content that educates and engages. Static infographics get lost in the feed. AECharts enables the creation of captivating animated chart videos perfect for platforms like LinkedIn, Instagram Reels, TikTok, and YouTube. Animate your quarterly growth metrics, showcase survey results, or create a trending bar chart race to highlight industry shifts. These videos dramatically increase view time, shares, and overall engagement compared to static images, helping your message stand out in crowded social feeds.
Dynamic Business & Investor Presentations
Founders, executives, and sales teams often rely on PowerPoint or Google Slides to communicate performance, strategy, and forecasts. Embedding a standard chart can make a slide feel static and dated. By importing an AECharts MP4 video directly into your slides, you can transform your presentation. Animate revenue growth, market share expansion, or user acquisition trends right in front of your audience. This dynamic approach holds attention, makes complex data intuitive, and projects a modern, data-driven, and professional image to stakeholders and potential investors.
Data-Driven Journalism & Reporting
Journalists and researchers need to present data-heavy stories in a way that is both accurate and accessible to a broad audience. Text descriptions and static graphs in articles or reports can fail to convey trends effectively. AECharts allows for the quick creation of animated visualizations that can be embedded in online articles or shared on social media to accompany a story. Animating election results over time, economic indicators, or public health data helps readers visually grasp the narrative and significance behind the numbers, enhancing understanding and impact.
Internal Reporting & Team Communications
Internal teams, such as operations, product, or HR, regularly review metrics and KPIs. Sharing these updates via email with attached spreadsheets or static slides leads to disengagement. Using AECharts, teams can create short, animated summary videos of weekly dashboards, project progress, or departmental achievements. These videos can be shared in team meetings, internal newsletters, or communication platforms like Slack. The animated format makes internal reporting more engaging, ensures key takeaways are memorable, and fosters a data-informed culture.
Frequently Asked Questions
What is AECharts?
AECharts is a specialized online tool designed to create animated chart videos directly from your data. It solves the problem of needing complex video editing or design software to make data visualizations engaging. You input data from spreadsheets, CSV files, or Google Sheets, and AECharts transforms it into a polished, animated video (MP4) or image (PNG/JPEG) within minutes, requiring no prior technical or design expertise.
Who is this tool designed for?
AECharts is built for professionals who need to communicate data clearly and memorably but lack the time or skills for complex software. Primary users include marketers creating social media content, journalists illustrating stories, researchers presenting findings, founders pitching to investors, and any business team preparing internal or external reports and presentations. It's for anyone who wants to upgrade from static charts to dynamic data storytelling.
Do I need coding or design skills to use it?
No, absolutely not. AECharts is specifically designed to be a zero-code, no-design-skills-required solution. The entire process is point-and-click and guided. You choose a chart type from a menu, paste your data, and use intuitive visual controls to customize templates, colors, and fonts. The platform handles all the complex animation and design rendering in the background, making professional results accessible to everyone.
What export formats are available?
AECharts provides versatile export options to suit different needs. For video use, you can export your creation as an MP4 file. For static image needs, you can export high-quality PNG or JPEG files. Furthermore, exports can be configured in various aspect ratios, including standard 16:9 for presentations, 1:1 for Instagram posts, and 4:5 for mobile-friendly Reels and TikTok videos, ensuring your content is platform-ready.
Similar to AECharts

MagicShot AI
MagicShot.ai is where creators, job seekers & businesses make visual content with AI, photoshoots, image generation, videos & edits from a single upl

Easymotion - AI Motion Graphic Generator
AI motion graphics and map animation generator for content creators, editors, founders and marketers.

Receiptum
Receiptum allows you to effortlessly create customizable, professional receipts in seconds, no design skills required.

blauwdruk.
Blauwdruk creates your complete website, from custom design to SEO, so you can focus on growing your business without the hassle.
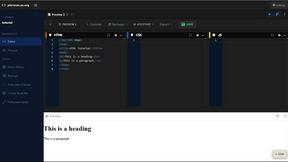
Pterocos
Pterocos is a free online HTML editor that lets you code in real-time with instant AI assistance, no installation required.
Sprite-AI
Stop struggling with pixel art and start generating game-ready sprites in seconds with Sprite-AI's simple text-to-pixel tool.

GirlGeneratorAI
Create stunning girl images effortlessly with GirlGeneratorAI, a free tool that transforms your text prompts into beautiful portraits.