LoadTester
Stop guessing about API performance with LoadTester, the modern tool that runs distributed HTTP load tests from your browser or CI/CD with live.
Visit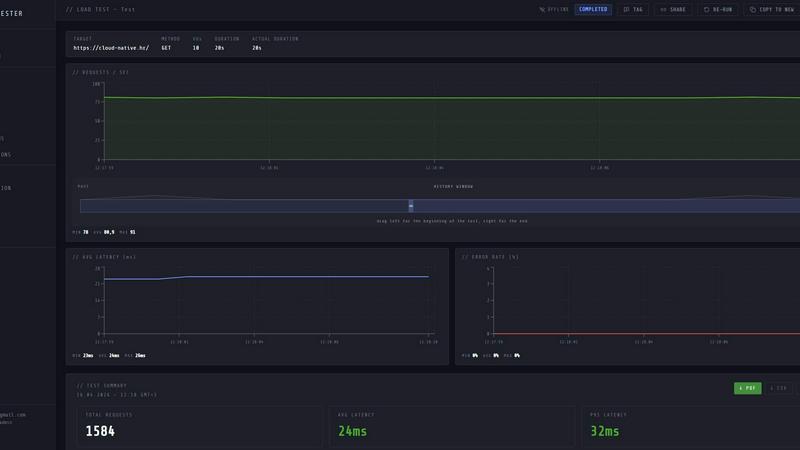
About LoadTester
LoadTester is a modern HTTP and API load testing tool engineered by Cloud Native d.o.o. for engineering teams that need repeatable, reliable performance checks without the overhead of managing infrastructure. It solves the core problem that plagues performance testing: the gap between wanting to run a load test and actually having the platform, workers, and results pipeline ready to go. With LoadTester, you create a test scenario, choose your mode whether virtual users or requests per second, and launch instantly from your browser or CI/CD pipeline. The platform handles distributed worker scaling, live telemetry, and automatic threshold enforcement, so your team focuses on interpreting results rather than orchestrating infrastructure. It is built for developers, QA engineers, and platform teams who need to catch performance regressions before users notice them, validate capacity before launches, and maintain service level objectives across deployments. LoadTester supports exports, scheduled tests, API access, and workflow integrations, making it suitable for both ad hoc debugging and continuous performance validation. With a cold start under three seconds, support for up to 10,000 virtual users, and a typical success rate of 99.8 percent, it delivers production-grade load testing without the production-grade setup cost.
Features of LoadTester
Instant Distributed Execution
Start distributed load tests in seconds with no infrastructure setup, worker orchestration, or scheduling headaches. LoadTester boots workers in under three seconds and auto-scales them based on your test configuration, whether you choose virtual users or requests per second mode. The queue time is effectively zero milliseconds, meaning your test begins almost immediately after you hit run. This feature eliminates the traditional bottleneck of provisioning servers, configuring load generators, and managing execution flow, allowing your team to focus entirely on results and performance analysis.
Live Analytics and Telemetry
Watch requests, latency, failures, throughput, and bottlenecks in real time while your test is running. The live console displays key metrics including requests per second, p50, p95, and p99 latency, error counts, and active virtual users, all updating during the run. A latency distribution chart shows the last 60 seconds of p50, p95, and p99 trends, helping you spot degradation as it happens. This real-time visibility transforms load testing from a post-mortem activity into an interactive debugging session where you can observe system behavior under load and make immediate adjustments.
Smart Auto-Stop with Thresholds
Set failure or latency thresholds and automatically stop tests when things go sideways. You can configure guards for p95 latency limits, error rate percentages, and regression comparisons against baseline runs. When a threshold is breached, LoadTester can auto-stop the test, notify Slack and email, or trigger a webhook to your release bot. This feature prevents wasted resources on failing tests and ensures that performance regressions are caught and communicated immediately, not discovered hours later in a log file.
CI/CD Ready with Webhooks and Alerts
Run tests on every deploy and integrate performance validation directly into your development pipeline. LoadTester supports scheduled tests, API access for programmatic control, and webhooks for completion events. You can trigger tests from CI/CD platforms, receive result links to release bots, and set up nightly release gates that run automatically. This automation ensures that performance testing becomes a repeatable, enforceable part of your deployment process rather than an occasional manual effort.
Use Cases of LoadTester
Pre-Launch Capacity Validation
Before launching a new feature or marketing campaign, engineering teams need to prove that their application can handle the expected traffic spike. LoadTester allows you to create a spike test targeting your checkout or authentication endpoints, set thresholds for p95 latency and error rate, and watch the results live. If the system buckles under load, you catch it before real users experience slowdowns or failures. The ability to compare runs against a baseline helps you validate that performance improvements actually work and that new code does not introduce regressions.
Continuous Performance Monitoring in CI/CD
Integrate load testing into your deployment pipeline so every pull request or release candidate is automatically validated for performance. LoadTester can be triggered via API or webhooks, run scheduled nightly tests, and alert your team via Slack or email when thresholds are breached. This use case transforms performance testing from a periodic, manual activity into a continuous guardrail that prevents performance degradation from reaching production. Teams can set up release gates that block deployments if p95 latency exceeds a defined limit or if error rates spike.
Debugging Performance Bottlenecks Under Load
When users report slow page loads or intermittent errors, developers need to reproduce the issue under controlled conditions. LoadTester lets you run a targeted test against a specific endpoint with a defined number of virtual users or requests per second, while watching live latency distribution charts. You can see exactly when p95 latency starts climbing and correlate that with error rates. This real-time visibility helps you identify whether the bottleneck is in database queries, third-party API calls, or application logic, without needing to instrument your entire stack first.
Scheduled Baseline and Regression Testing
Maintain a historical record of your application's performance by running scheduled tests daily or weekly at the same time and with the same parameters. LoadTester stores completed results and allows you to compare runs side by side, highlighting changes in throughput, latency, and error rates. This use case is critical for teams that deploy frequently and need to ensure that performance does not degrade over time. When a regression is detected, thresholds can trigger notifications or even auto-stop the test, giving you a clear signal that something changed and needs investigation.
Frequently Asked Questions
How does LoadTester handle infrastructure and scaling?
LoadTester manages all infrastructure for you. When you launch a test, it automatically dispatches workers across distributed nodes, scales them based on your test configuration, and handles coordination and execution flow. There is no infrastructure to provision, no servers to manage, and no scheduling to set up. The cold start time from test launch to first request is under three seconds, and the platform can scale to 10,000 virtual users or 10,000 requests per second without any manual intervention.
What metrics are available during a live test and after completion?
During a live test, you can see real-time metrics including requests per second (RPS), p50, p95, and p99 latency, error count, success rate, and active virtual users. A latency distribution chart shows the last 60 seconds of p50, p95, and p99 trends. After the test completes, you get a clear summary with total requests, average latency, p95 latency, data sent, data received, and error breakdown. Results can be exported as PDF, CSV, or JSON for sharing with your team or integrating into reporting tools.
Can LoadTester be integrated into my existing CI/CD pipeline?
Yes, LoadTester is designed for automation and integration. It provides API access for programmatic test creation and execution, supports webhooks for completion events, and can send alerts to Slack and email. You can trigger tests from any CI/CD platform, set up scheduled tests that run at defined intervals, and configure release gates that block deployments if performance thresholds are breached. This makes it easy to enforce performance validation as a standard step in your development workflow.
What happens when a test exceeds my defined thresholds?
LoadTester supports smart auto-stop based on thresholds you configure. You can set guards for p95 latency limits, error rate percentages, and regression comparisons against a baseline run. When a threshold is breached, LoadTester can automatically stop the test to prevent wasted resources and further load on your system. It can also trigger notifications via Slack and email, or send a webhook to your release bot or incident management system. This ensures that performance regressions are caught and communicated immediately.
Similar to LoadTester
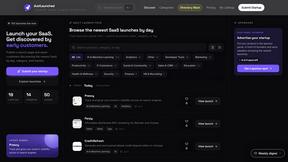
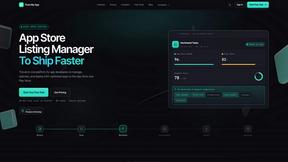
JustLaunched
The launch platform for indie makers — schedule your launch, get in front of buyers, and blast across directories.
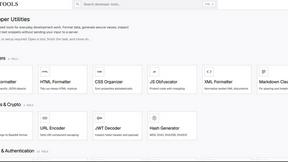
JavaScript Tools
JSTools.Space is a free collection of privacy-first developer utilities for formatting code, inspecting JSON and tokens, generating secure values, enc

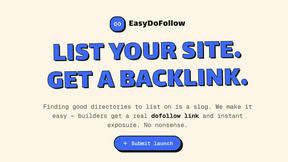
EasyDoFollow
Stop wasting hours hunting for directories; EasyDoFollow gives you a verified dofollow backlink by simply listing your site and adding a badge.